|
DAMS Software
Advanced
Features
Spherical Plots &
Iso-Spheres
Version 4 now offers spherical plots with
iso-spheres and you can project the response on to a sphere of radius
equal to the platform separation and grid equal to the measurement
Comes Standard
with the ALL DAMs Systems

|
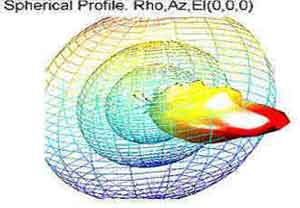
Each sphere represents
an Isotropic gain in dBi. The antenna plot is derived from S21
If you look down at
the main lobe and use the rendered Iso-Sphere you can easily visualize
the associated beam widths by specifying the Iso-Sphere grid
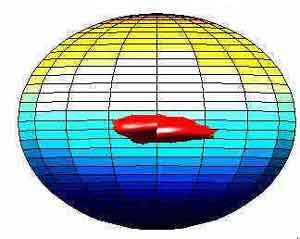
A play mode is also
available to play the profile through the frequency range. This yields
some amazing movies.
The DAMS 6000 is
required for this software.
Version 4.5
Is Available Now!
This software contains upgraded AZ/EL 3D plots along with some minor
updates.
Please contact us to access this download.
|
DAMs Software
Comes Standard
with the ALL DAMs Systems
Designed for quick learning
and maximum productivity the D.A.M.S. Software has been designed with
many time saving features including instant help which provides on the
spot help for any function.
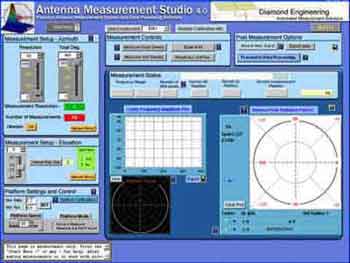
An all-on-one Page contains
everything you need to completely measure an antenna including A Polar
Plot, Resetting Amplitude Plot, and a Non-Resetting history plot.
Use the export function to put all of your data into a file to be used
with Math-CAD or imported into Excel.
Please See our Advanced Processing Add-on for advanced features such as
Group Delay functions and 3D plots with multiple data registers.

|
Measurement Features
-
Real-Time measurement
display of current gain @ position.
-
Ideal Antenna Overlay for antenna comparison.
-
Completely De-Embedded Measurements (full calibration- no outside
interference) Of Antenna Data Only.
-
Data Export with Variable Format option
-
Measure up to 2800 points per frequency in one 360 degree sweep.
-
Variable speed.
-
Move to Max Position.
-
Vertical/Horizontal Combination Sweep Measurements.
-
CW/CCW Antenna rotation.
Visualization Features
-
All Plots operate in
Real-Time
-
Printable Plots
-
Resetting Amplitude Plot
-
Non-resetting History Plot
-
Polar Radiation Plot
-
Instant support system
-
Color Coded measurement controls
-
3D plots (only available with Advanced Processing Add-on)
-
Real-Time Measurement Status
|
DAMs Software Advanced
Features
This Also Comes Standard
with the ALL DAMs Systems
Our Advanced processing software
enables you to take antenna measurements to the next level. Using state of
the art data mapping routines our software can take an array of
measurements and turn them into a 3D plot mapping the response of Multiple
frequencies over rotation.
Along with 3D plotting, the Advanced processing Software has A Group Delay
section, Stem Cell Plots area and Real-Time Amplitude over Frequency
function.
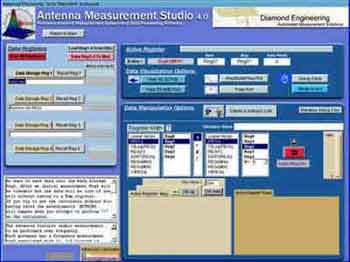
The Advanced Processing page
contains all of the necessary elements to fully profile a specific
antenna. The four data Registers are used to store multiple antenna
profiles for comparison
|
|
Advanced Processing Features |
|

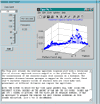
3D Plotting Features
|
|
Fully
Rotational 3D plots
High quality prints
Completely Exportable
500,000 measurement capacity
Plots Amplitude Vs. Frequency Vs. Rotation
|
|
Dynamic Stem Vector Features
|
|
3D Stem Cell
Plots
Different plot for each frequency
Plot from multiple data sets
Amplitude Mapping
Fully Printable
|

Group delay Features
|
|
Group Delay
Measured in Nano Sec, Feet, and Inches
View path propagation over frequency
Printable graphs
Calculate distance between 2 antennas
|
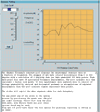
Dynamic Plotting
|
|
Fully Dynamic
plotting with Real-Time changes
Amplitude Vs. Frequency Chart
Printable graphs
Locate most useful area of antenna for specific frequency
range
up to 200 measurements over 500Mhz range
|
|
|


